Python Data Visualization
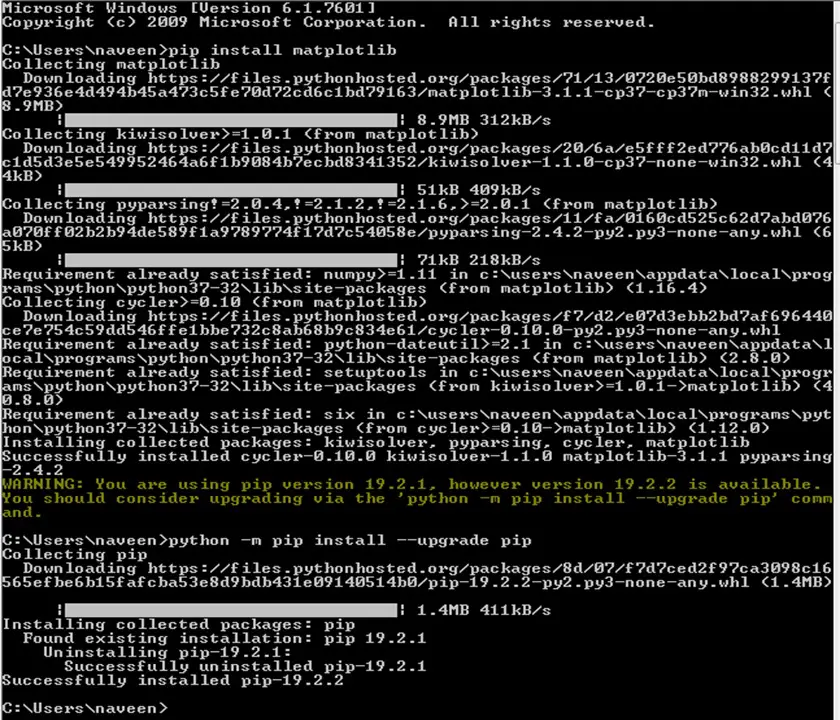
When data is shown in the form of pictures, it becomes easy for the user to understand it. Representing the data in the form of pictures or graphs is called 'data visualization '. For this purpose, we can use pyplot submodule of the matplotlib module. For complete information about this module, you can refer to the page: https://matplotlib.org/api/pyplot_summary.html