Java Thread Dump
Java thread dump is a stack traces of all active threads in a Java Application. Which gives the information or state of all Java Threads which are live/active in a running Application of Java and their states.
Collect Thread dump on Linux/Windows
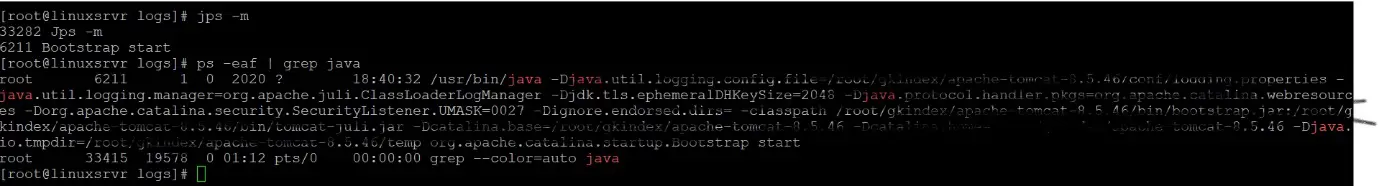
Find the process id of the Java application for which you want to collect thread dump, by using any of the following commands
jps This is an inbuilt tool which comes with Java(JDK tools) useful to find the process ids of the java application
ps -eaf | grep java
"This 'ps' command comes with Unix or Linux itself"
Using kill -QUIT or kill -3 as shown below.
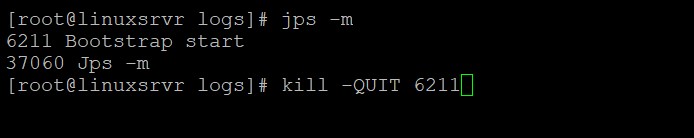
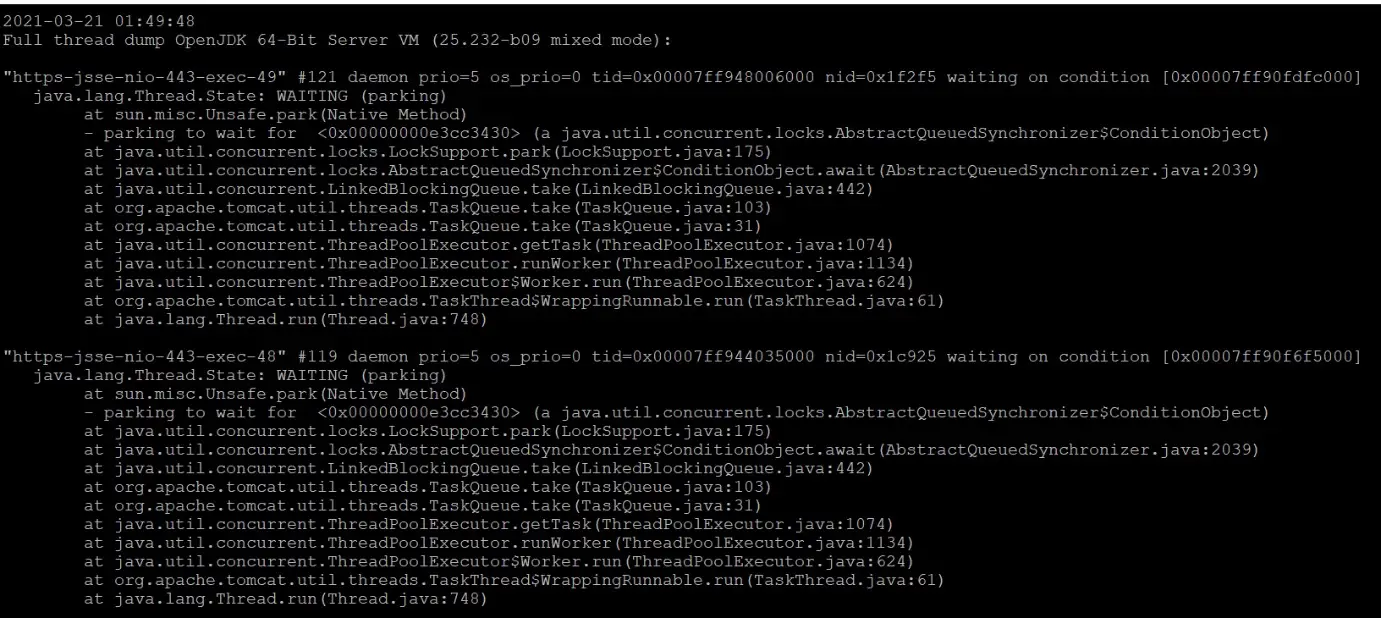
kill -QUIT or kill -3 will produce the following output of stdout console of Java
Using Java in built tools
- jstack
- jcmd
- jconsole
- jmc
- jvisualvm
jconsole,jmc and jvisualvm are the UI based tools. Taking java thread dumps is a difficult task to use UI tools while we are using Unix or Linux boxes
Collect Thread dump using jstack
In this section, lets use the jstack to collect thread dumps from both Linux/Unix and Windows
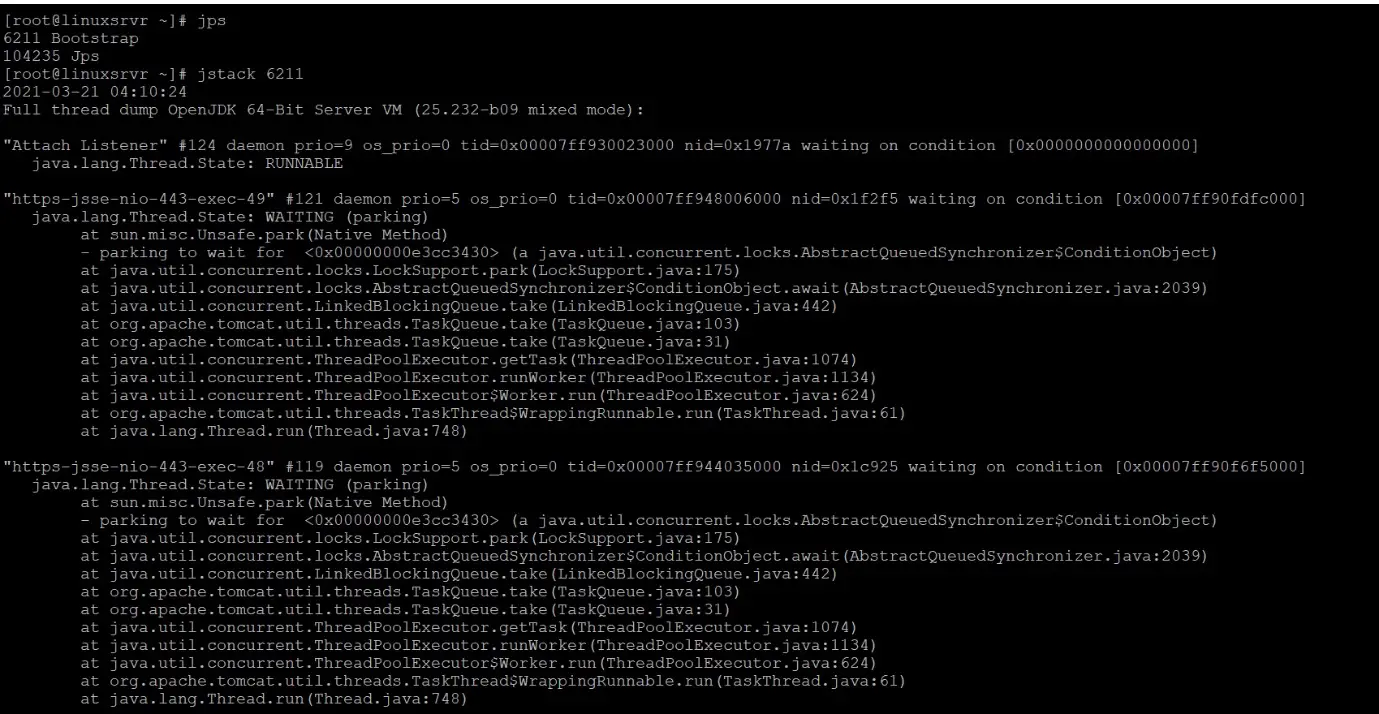
Output of jstack will be printed in the terminal which we used, we can direct the output of jstack to any file by using the redirect command
jstack java_application.pid >> thread dumps.txt