Java Heap dump
Java Heap dump is a snapshot of a Java Application memory or a heap in the form of a file. Heap dump cane be collected for analyzing the memory leaks or performance related issues. There are many readily available user Interface tools are available to collect the heap dump. In this article will use a jmap to collect the heap dump of running java application.
Java Heap dump on Linux(Unix) / Windows
jmap comes by default with the JDK package itself, no need of any additional installable files in unix/linux or windows. jmap works the same way in both windows and unix/linux operating systems. Pre-requisite before using the jmap is we should know the process id of the java application for which we need to take the heap dump.
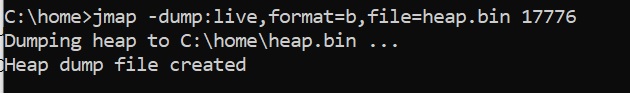
Once we know the process id, the following command will be helpful to generate the heap dump.
Syntax:
jmap -dump:live,format=b,file=heap.bin <pid>
where 'pid' will be the java application process id.
-dump option is for dumping java heap in hprof binary format.
if we specify as live, it dumps only live objects otherwise it will dump all the objects in the heap memory.
-format is used to specify the format of the heap dump file.
file is used to give the name of the file, which will be user choice.